Finally, we looked at what happened when cuts to public services were added to the impact of cuts to tax and social security.
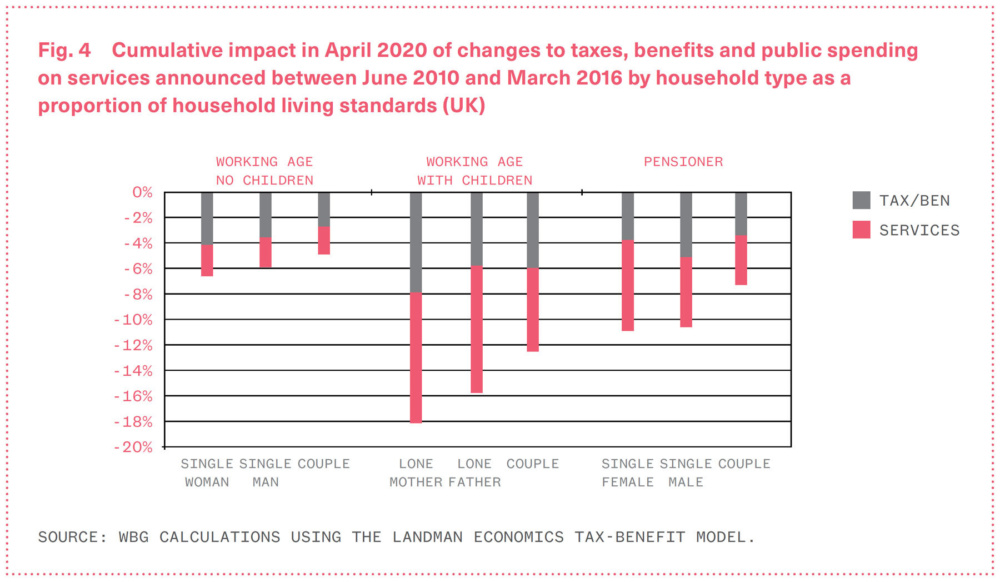
The graph below shows what happens to the living standards (disposable income plus the value of free public services) of households by gendered characteristics. There is a loss of 18% in average living standards for lone mothers and 12% for couples by 2020. Single pensioners are badly affected by the cuts to services and stand to lose more than 10% of their living standards. For households with children and for pensioners, cuts to public services will have a larger impact than tax-benefit changes.
Cumulative impact in April 2020 of changes to taxes, benefits and public spending on services announced between June 2010 and March 2016 by household type as a proportion of household living standards.