We also looked at the impact of cuts to public services. In this case we did our analysis at the household level because the level of public services impacts on the whole household as well as the direct recipient.
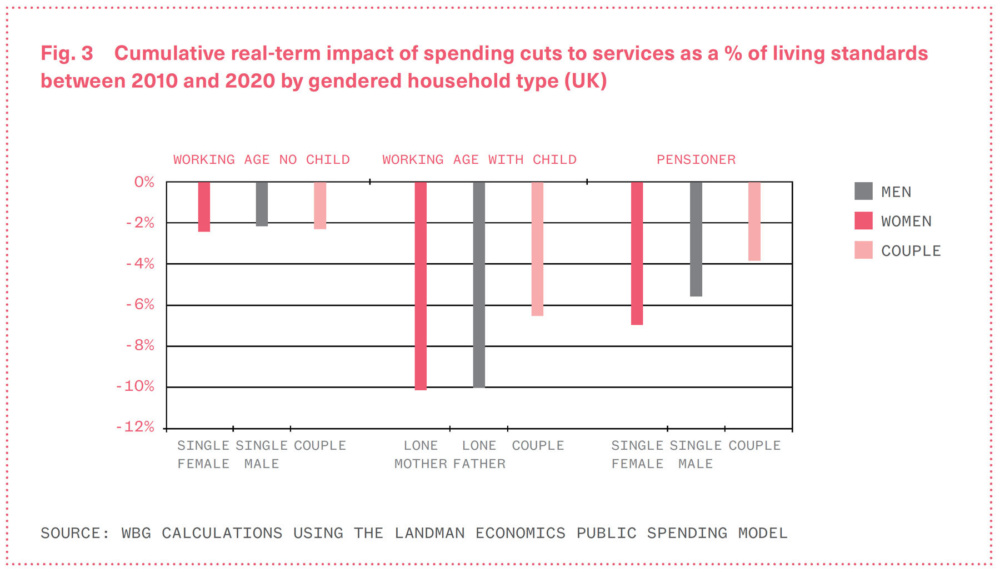
The graph below shows that household with children stand to lose most from cuts to public services both in cash terms and as a percentage of their living standards, mainly due to cuts to education services. Lone mothers account for 92% of all lone parents, they will see living standard fall by 10.2%. Couples with children experience a decline of 6.5%. Single female pensioners experience a 7.1% fall in living standards, mainly because of cuts to social care.
Cumulative real-term impact of spending cuts to services as a % of living standards between 2010 and 2020 by gendered household type.